
With Bitcoin trading near $82,000, a move back into price-discovery territory depends on whether ETF buyers keep absorbing supply while macro pressure remains contained.
That is the practical answer to the two questions shaping the rest of 2026: when can Bitcoin reach a new all-time high, and is the market bottom already in?
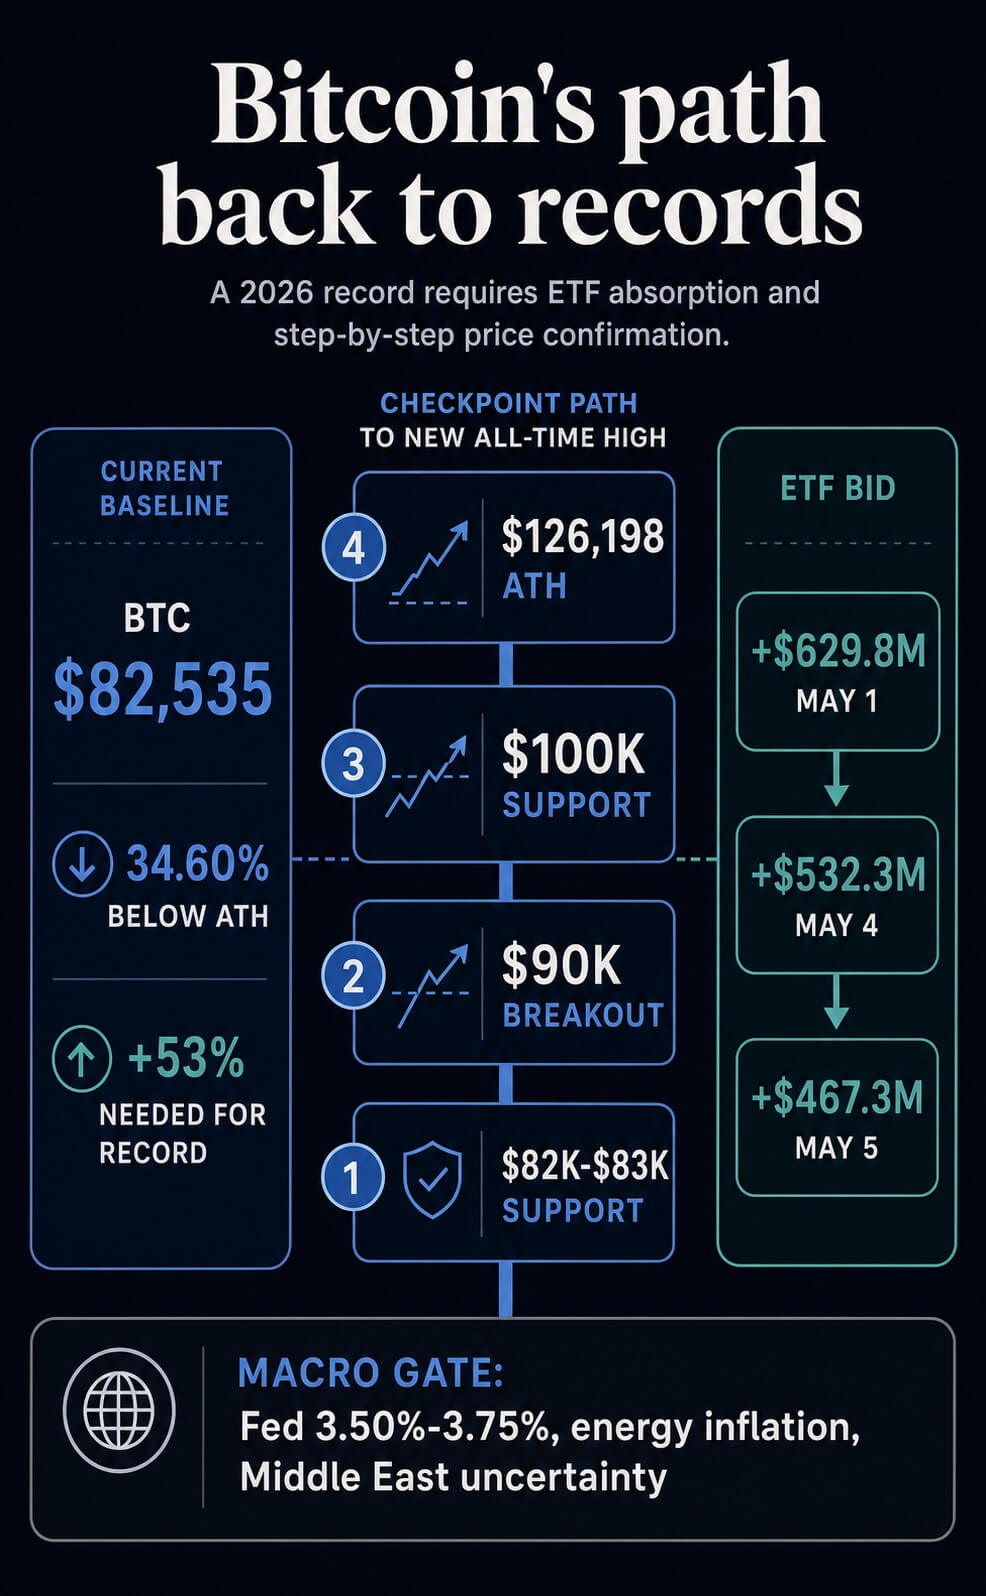
Bitcoin has reclaimed the low-$80,000 range and is again testing whether buyers can build support there. Yet it remains over 30% below its Oct. 6, 2025, all-time high of $126,198, according to live Bitcoin pricing.
The distance to the peak is the first constraint. From roughly $82,000, Bitcoin needs a gain of about 54% to set a fresh record.
Spot ETFs are again taking in hundreds of millions of dollars a day, but the old high still has to be treated as a supply zone to be cleared rather than as a price level that automatically reaches.

The clearest take is conditional. Bitcoin can plausibly reach a new all-time high in late Q3 or Q4 2026 if it first turns the $82,000-$83,000 area into support, clears $90,000, and then reclaims $100,000 while ETF inflows remain positive.
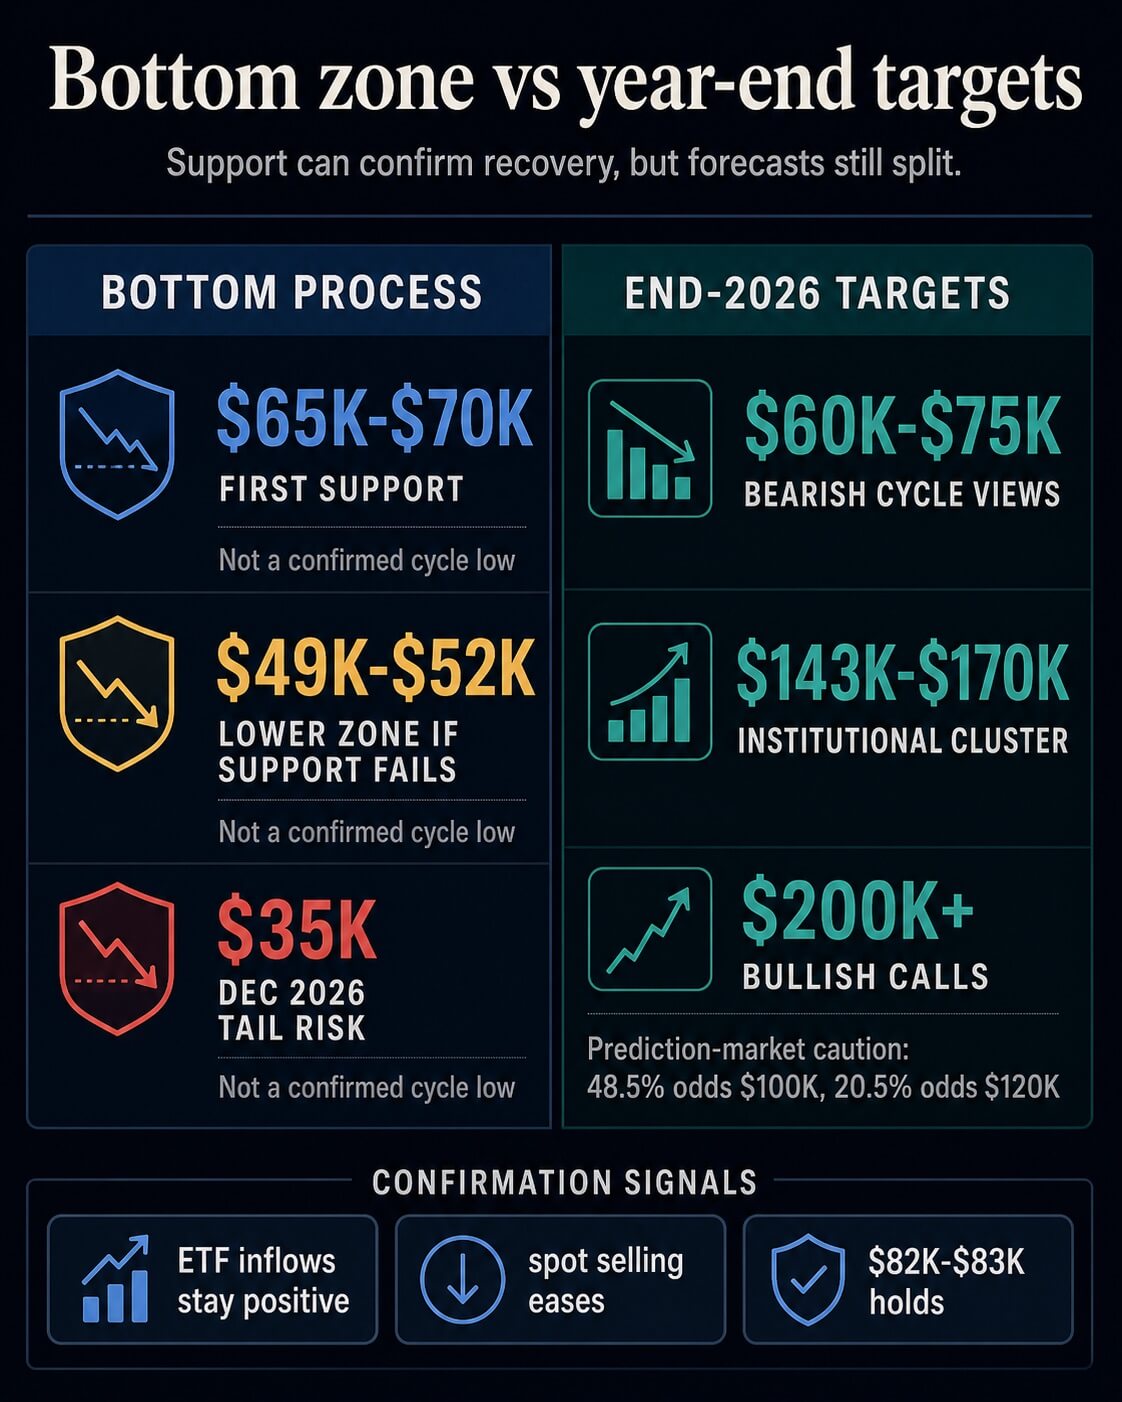
The bottom, meanwhile, should be treated as a process rather than a date. The first support zone for that process is $65,000 to $70,000. If that fails, lower downside work remains live.
The low-$80,000 range is the first gate
The immediate test is lower than the old record. Recent CryptoSlate price coverage framed the low-$80,000 range as the zone Bitcoin needs to convert from resistance into support before the $90,000 trade becomes credible.
That aligns with the current market structure: BTC has moved back above the psychological $80,000 line, but the move remains within a large overhead supply band created by buyers who entered closer to the 2025 peak.
ETF demand is why the upside case remains alive. Farside Investors’ US spot Bitcoin ETF flow table showed net inflows of $629 million on May 1, $532 million on May 4, and $467 million on May 5.
Those flows are a demand proxy that can help absorb profit-taking from older holders and recent buyers who want to exit near breakeven.
The same flow channel also explains why this cycle is harder to compare with prior post-halving years. The ETF market has created a regulated access point for spot exposure.
BlackRock’s iShares Bitcoin Trust remains a deep and liquid wrapper, showing that ETF demand is not just a trading-screen abstraction.
Still, ETF demand can soften quickly when macro pressure rises or when holders sell into strength faster than new capital arrives. That is why $82,000-$83,000 is the first gate.
A clean hold there would make $90,000 the next live test. A failure would turn the current rebound back into another relief rally inside a defensive structure.

The supply side is the factor that keeps the chart from becoming a simple ETF-flow setup. Glassnode’s early-April work described overhead supply from $80,000 to $126,000 and roughly 8.4 million BTC held at a loss.
Every step higher through that range can invite selling from holders who bought nearer the top, so the rally has to prove that fresh demand is stronger than exit liquidity.
The bottom call needs more humility
On-chain data does not support a confident declaration of the bottom. Glassnode’s late-April Week On-chain report said Bitcoin remained capped by the True Market Mean and the short-term holder cost basis, while support clustered near $65,000-$70,000.
That support zone defines the first serious retest if the low-$80,000 recovery fails.
A support zone and a confirmed cycle low are different claims. Glassnode’s earlier April work described Bitcoin as moving through redistribution rather than a clear uptrend, with overhead supply from $80,000 to $126,000 and about 8.4 million BTC held at a loss.
Rallies into the old range can therefore trigger selling from investors who bought higher and want out.
The better answer is that Bitcoin may be building a bottoming structure, but it has not yet proven one. The $65,000-$70,000 area is the first level to watch if the current low-$80,000 recovery fails.
A successful retest there, followed by renewed ETF inflows and easing spot selling, would strengthen the case that a tactical bottom formed.
If that zone breaks, the risk profile changes. Earlier Bitcoin bottom analysis kept lower zones in play, while a separate cycle model projected a more severe late-2026 low near $35,000 if the old post-halving pattern reasserts itself.

That model remains a tail risk while ETF demand is improving, but it becomes harder to dismiss if support fails and flows reverse.
The bottom question, therefore, has two answers. The tactical bottom may already be forming if $65,000-$70,000 survives and Bitcoin continues to reclaim higher cost-basis levels.
The cycle bottom is not confirmed unless the market can absorb the overhead supply and hold higher support through another macro shock.
That distinction also shapes timing. A bottom confirmed by support and ETF demand would give Bitcoin more runway for a late-2026 push.
A failed retest would push the market back toward capital preservation, delayed price targets, and the older cycle models that see the final low arriving closer to year-end.
The record window depends on liquidity
The all-time-high question is easier to frame once price targets are separated from triggers. Bitcoin can reach a record without every macro variable turning friendly, provided liquidity conditions stop working against risk appetite, and ETF demand keeps absorbing spot supply.
The April 29 Federal Reserve statement kept the target range at 3.50%-3.75%, noting that inflation was elevated partly due to higher global energy prices and Middle East uncertainty.
That backdrop gives risk assets less room for a frictionless path higher. It also explains why Galaxy Digital’s Michael Novogratz told Bloomberg in late April that Bitcoin would be difficult to retake $100,000 without an easing central bank.
A 2026 record remains possible under that backdrop, but the burden of proof sits with market structure. Bitcoin needs to hold the low-$80,000 range and keep ETF inflows steady enough to absorb profit-taking.
If short positioning remains heavy, a push through resistance could add squeeze risk, but that should be treated as a possible accelerant rather than a requirement.
The next visible steps are $90,000 and $100,000, followed by the long climb back toward $126,198.
Late Q3 to Q4 is the most defensible window because it gives the market time to do that work. A faster move is possible if ETF inflows accelerate and macro data give the Fed room to sound less restrictive.
A delay into 2027 becomes more likely if oil-led inflation keeps rates higher, the dollar and yields pressure risk assets, or spot ETFs return to persistent outflows.
The timing call should therefore be tied to a checklist, not a calendar box. A record attempt needs support at $82,000-$83,000, a clean break of $90,000, proof that $100,000 can become support, and ETF absorption that survives risk-off sessions.
Without those pieces, bullish year-end targets remain possible outcomes rather than the market’s base case.
Forecasts and positioning diverge
CoinGecko’s April forecast aggregation showed a wide spread: bearish cycle views around $60,000-$75,000, institutional-style targets around $143,000-$170,000, and more bullish calls above $200,000.
Bitwise’s 2026 outlook goes further on structure, arguing Bitcoin can break the four-year cycle and set new all-time highs as ETF demand exceeds new supply.
Prediction-market pricing is less enthusiastic. CoinGecko’s prediction-market page shows 48.5% odds of Bitcoin reaching $100,000 by year-end and 20.5% odds of $120,000.
Those numbers do not disprove the analyst’s target cluster, but they show that traders are not treating $150,000-$200,000 as the base case yet.
| Question | Base read | Confirmation signal | Main risk |
|---|---|---|---|
| New all-time high | Late Q3 to Q4 2026 is plausible, but conditional | BTC holds $82,000-$83,000, clears $90,000, reclaims $100,000, and ETF inflows stay positive | Macro pressure or holder selling blocks the move before $100,000 |
| Market bottom | Bottoming process, not a confirmed low | $65,000-$70,000 survives a retest and spot selling eases | A break of that zone reopens lower late-2026 downside models |
| End-2026 consensus | Notable analyst targets cluster near $150,000, with bulls above $200,000 | ETF demand keeps absorbing supply and macro conditions improve | Prediction-market odds remain far below bullish desk targets |
Bitcoin has entered a measurable confirmation phase. ETF inflows have repaired the bull case, but they have not completed it.
On-chain data still shows overhead supply, macro policy is not yet a clear tailwind, and market-implied odds remain below bank and asset-manager target tables.
For now, a new all-time high before year-end 2026 is credible if Bitcoin holds the low-$80,000s and keeps absorbing supply through the ETF channel. The bottom is not confirmed, but the next serious test sits near $65,000-$70,000.
Notable analyst targets cluster around roughly $150,000 for year-end 2026, yet the market is still demanding proof before pricing that outcome as the main path.
Analysis,Bear Market,Featured,Macro,Market#bear #market #bottom #Bitcoin #price #reach #alltime #high #126k1778095540